
visualisation

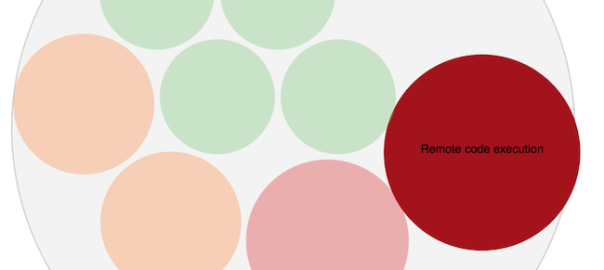
D3 experiments: Simple vulnerability summary representation
19 May Update I have improved a bit the host representation. Digging into d3 capabilities found several very useful capabilities like scales. Also utilising jQuery tipsy for nice hover text info display. That lead to v0.2 which could be found here. My first d3 experiment I have started experimenting with data visualisation recently using d3…

Cool visualisation ideas
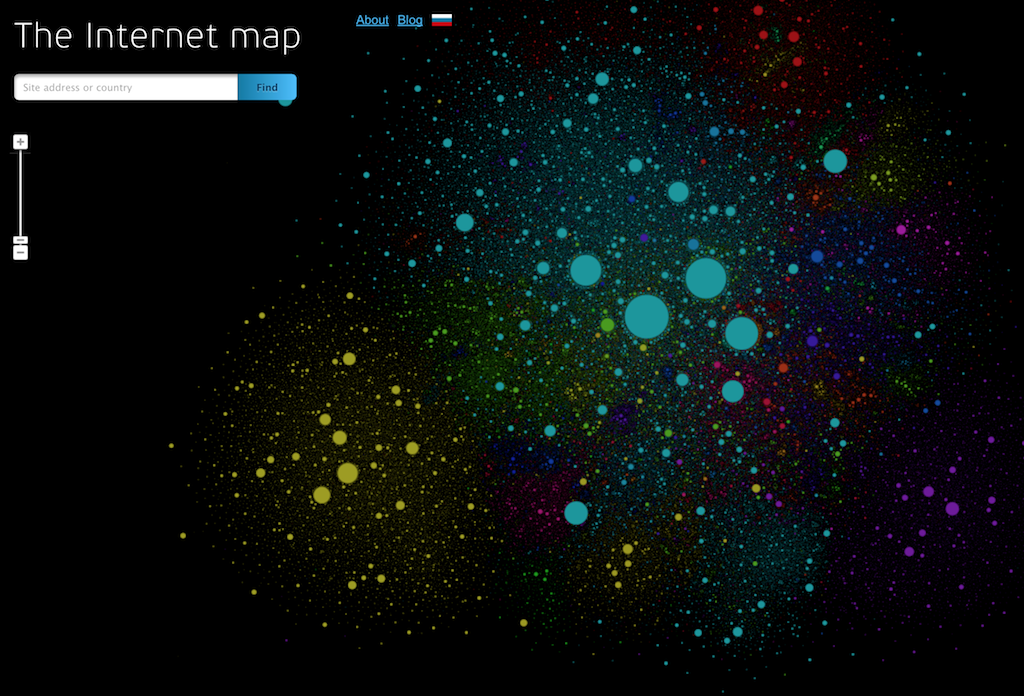
I have always admired people that could represent complex ideas in a simple way or have come up with ideas to visualise complex/big data in a graspable manner. Here is my personal collection of cool visualisations. If you have anything cool in your own collection, please drop me a line Enjoy! Internet map
Recent Posts




Tags
bruteforce bug bounty bug hunting Burp Suite d3 data leak data recovery dictionary entropy pool fix fuzzing hackaday image processing Journalistic tools log analysis malware mindmap online courses Practical Reverse Engineering randomness sandbox skype SQL injection SSL technical visualisaiton visualisation Vulnerability Management Wanda the fish Zeus