19 May Update
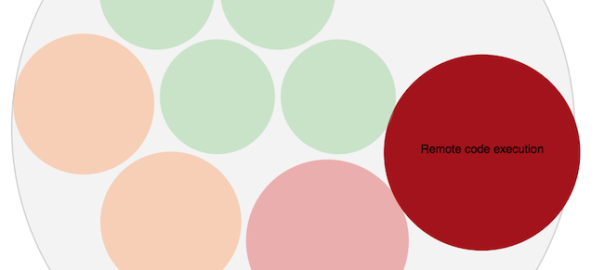
I have improved a bit the host representation. Digging into d3 capabilities found several very useful capabilities like scales. Also utilising jQuery tipsy for nice hover text info display. That lead to v0.2 which could be found here.
My first d3 experiment
I have started experimenting with data visualisation recently using d3 and json.
My idea is to have interactive and nice visual representation of host and network vulnerability exposure.
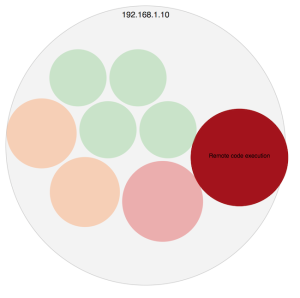
Here is my first attempt – it is a bit scruffy and very simple but good start I believe.
(Note: Click the image to open the interactive display)

Leave a Reply